CubicWeb Sprint report for the "Benchmarks" team
One team during the CubicWeb sprint looked at issues around monitoring benchmark values for CubicWeb development. This is a huge task, so we tried to stay focused on a few aspects:
- production reponse times (using tools such as smokeping and munin)
- response times of test executions in continuous integration tests
- response times of test instances runinng in continuous integration
We looked at using cpu.clock() instead of cpu.time() in the xunit files that report test results so as to be a bit more independent of the load of the machine (but subprocesses won't be counted for).
Graphing test times in hudson/jenkins already exists (/job/PROJECT/BUILDID/testReport/history/?) and can also be graphed by TestClass and by individual test. What is missing so far is a specific dashboard were one could select the significant graphs to look at.
By the end of the first day we had a "lorem ipsum" test instance that is created on the fly on each hudson/jenkins build and a jmeter bench running on it, it's results processed by the performance plugin.
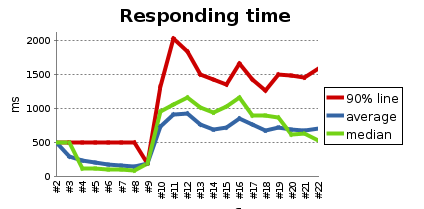
By the end of the second day we had some visualisation of existing data collected by apycot using jqplot javascript visulation (cubicweb-jqplot):

By the end of the sprint, we got patches submitted for the following cubes :
- apycot
- cubicweb-jqplot
- the original jqplot library (update : patch accepted a few days later)
On the last hour of the sprint, since we had a "lorem ipsum" test application running each time the tests went through the continuous integration, we hacked up a proof of concept to get automatic screenshots of this temporary test application. So far, we get screenshots for firefox only, but it opens up possibilities for other browsers. Inspiration could be drawn from https://browsershots.org/
