Reusing OpenData from Data.gouv.fr with CubicWeb in 2 hours
Two days ago, the French government released thousands of data sets on http://data.gouv.fr/ under an open licensing scheme that allows people to access and play with them. Thanks to the CubicWeb semantic web framework, it took us only a couple hours to put some of that open data to good use. Here is how we mapped the french railway system.
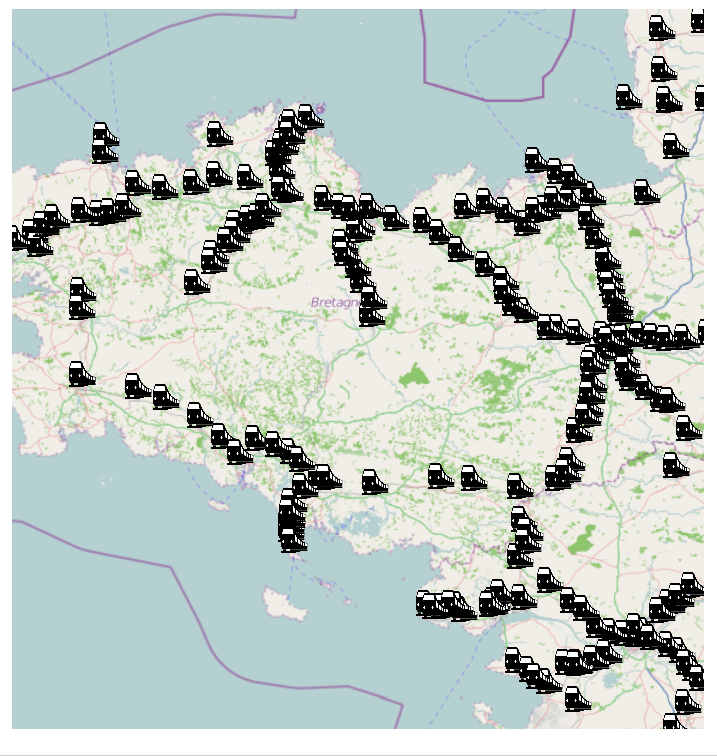
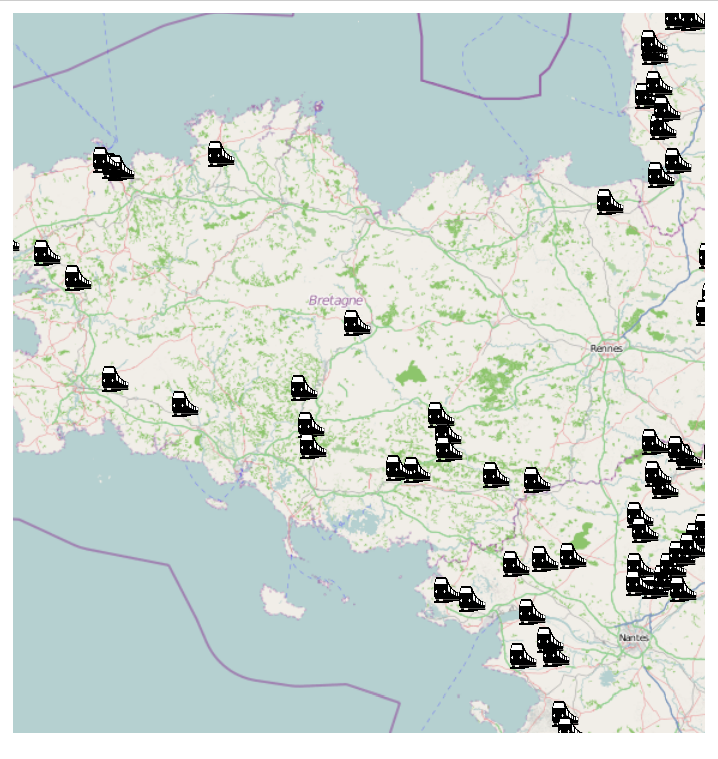
Train stations in french Britany
Source Datasets
We used two of the datasets available on data.gouv.fr:
- Train stations : description of the 6442 train stations in France, including their name, type and geographic coordinates. Here is a sample of the file
441000;St-Germain-sur-Ille;Desserte Voyageur;48,23955;-1,65358
441000;Montreuil-sur-Ille;Desserte Voyageur-Infrastructure;48,3072;-1,6741
- LevelCrossings : description of the 18159 level crossings on french railways, including their type and location. Here is a sample of the file
558000;PN privé pour voitures avec barrières sans passage piétons accolé;48,05865;1,60697
395000;PN privé pour voitures avec barrières avec passage piétons accolé public;;48,82544;1,65795
Data Model
Given the above datasets, we wrote the following data model to store the data in CubicWeb:
class Location(EntityType):
    name = String(indexed=True)
    latitude = Float(indexed=True)
    longitude = Float(indexed=True)
    feature_type = SubjectRelation('FeatureType', cardinality='?*')
    data_source = SubjectRelation('DataGovSource', cardinality='1*', inlined=True)

class FeatureType(EntityType):
    name = String(indexed=True)

class DataGovSource(EntityType):
    name = String(indexed=True)
    description = String()
    uri = String(indexed=True)
    icon = String()
The Location object is used for both train stations and level crossings. It has a name (text information), a latitude and a longitude (numeric information), it can be linked to multiple FeatureType objects and to a DataGovSource. The FeatureType object is used to store the type of train station or level crossing and is defined by a name (text information). The DataGovSource object is defined by a name, a description and a uri used to link back to the source data on data.gouv.fr.
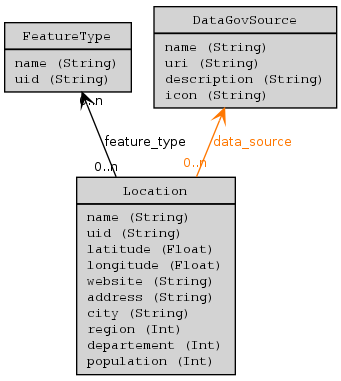
Schema of the data model
Data Import
We had to write a few lines of code to benefit from the massive data import feature of CubicWeb before we could load the content of the CSV files with a single command:
$ cubicweb-ctl import-datagov-location datagov_geo gare.csv-fr.CSV  --source-type=gare
$ cubicweb-ctl import-datagov-location datagov_geo passage_a_niveau.csv-fr.CSV  --source-type=passage
In less than a minute, the import was completed and we had:
- 2 DataGovSource objects, corresponding to the two data sets,
- 24 FeatureType objects, corresponding to the different types of locations that exist (e.g. Non exploitée, Desserte Voyageur, PN public isolé pour piétons avec portillons or PN public pour voitures avec barrières gardé avec passage piétons accolé manoeuvré à distance),
- 24601 Locations, corresponding to the different train stations and level crossings.
Data visualization
CubicWeb allows to build complex applications by assembling existing components (called cubes). Here we used a cube that wraps the Mapstraction and the OpenLayers libraries to display information on maps using data from OpenStreetMap.
In order for the Location type defined in the data model to be displayable on a map, it is sufficient to write the following adapter:
class IGeocodableAdapter(EntityAdapter):
      __regid__ = 'IGeocodable'
      __select__ = is_instance('Location')
      @property
      def latitude(self):
          return self.entity.latitude
      @property
      def longitude(self):
          return self.entity.longitude
That was it for the development part! The next step was to use the application to browse the structure of the french train network on the map.
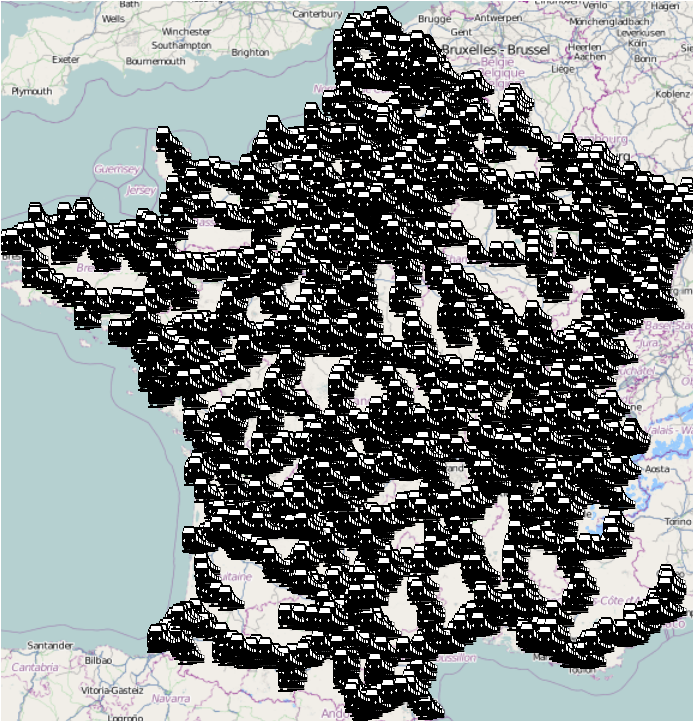
Train stations in use:
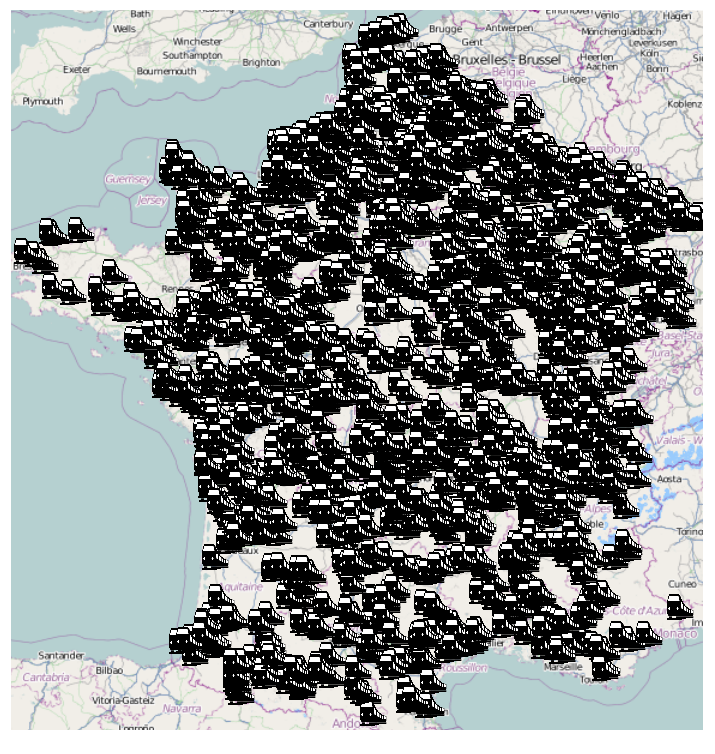
Train stations not in use:
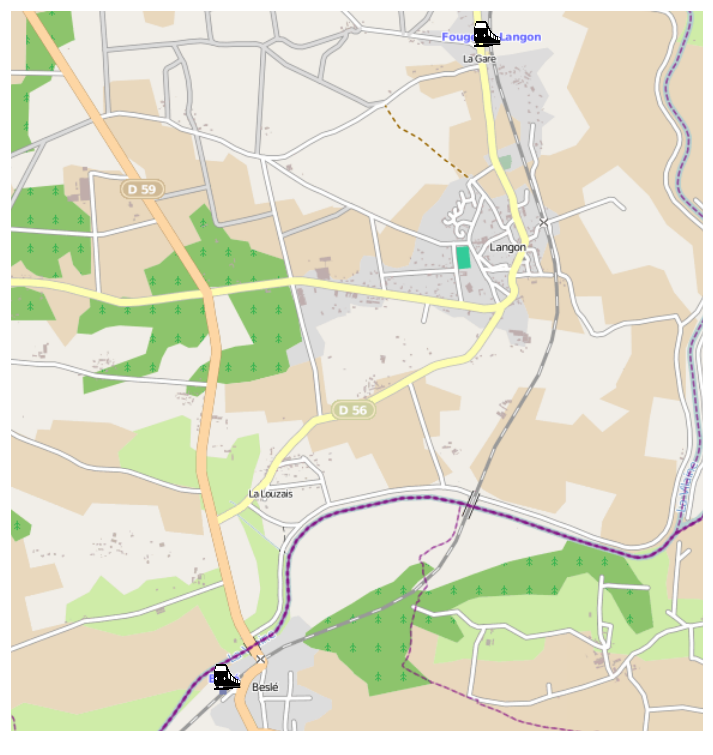
Zooming on some parts of the map, for example Brittany, we get to see more details and clicking on the train icons gives more information on the corresponding Location.
Train stations in use:
Train stations not in use:
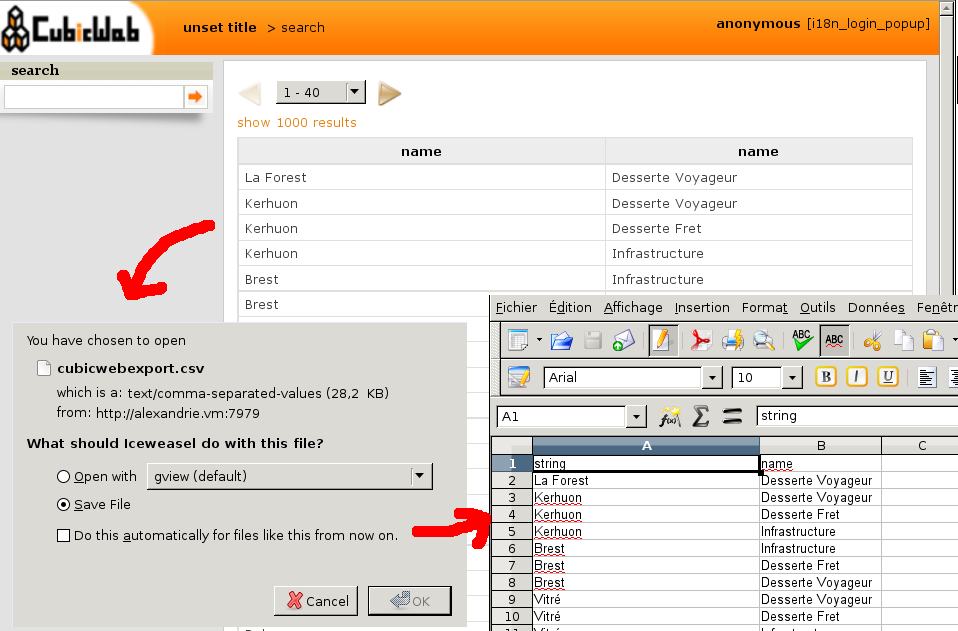
Since CubicWeb separates querying the data and displaying the result of a query, we can switch the view to display the same data in tables or to export it back to a CSV file.
Querying Data
CubicWeb implements a query langage very similar to SPARQL, that makes the data available without the need to learn a specific API.
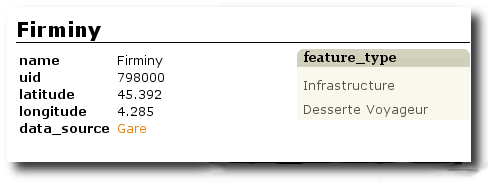
- Example 1: http:/some.url.demo/?rql=Any X WHERE X is Location, X name LIKE "%miny"
This request gives all the Location with a name that ends with "miny". It returns only one element, the Firminy train station.
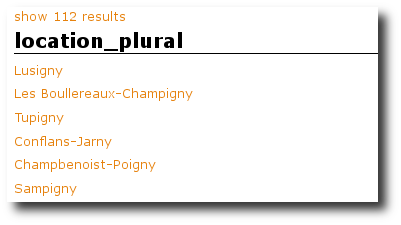
- Example 2: http:/some.url.demo/?rql=Any X WHERE X is Location, X name LIKE "%ny"
This request gives all the Location with a name that ends with "ny", and return 112 trainstations.
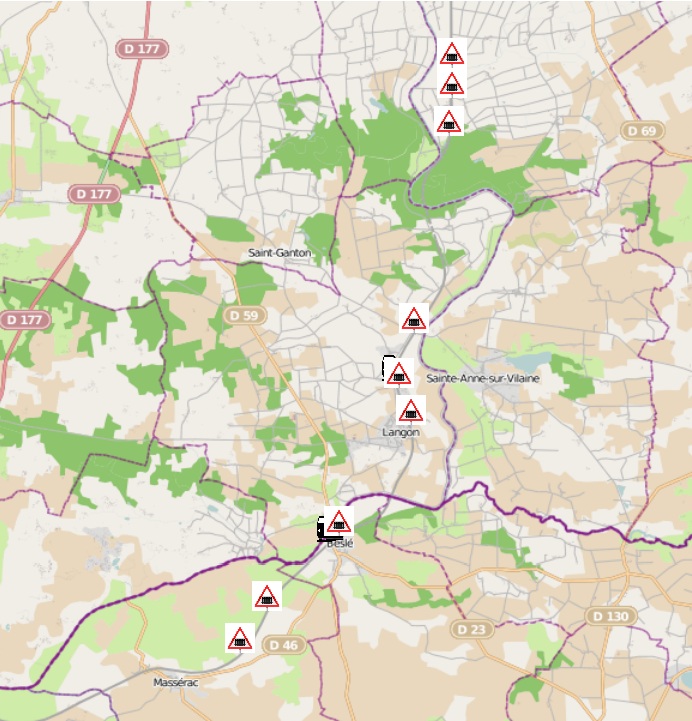
- Example 3: http:/some.url.demo/?rql=Any X WHERE X latitude < 47.8, X latitude>47.6, X longitude >-1.9, X longitude<-1.8
This request gives all the Location that have a latitude between 47.6 and 47.8, and a longitude between -1.9 and -1.8.
We obtain 11 Location (9 levelcrossings and 2 trainstations). We can map them using the view mapstraction.map that we describe previously.
- Example 4: http:/domainname:8080/?rql=Any X WHERE X latitude < 47.8, X latitude>47.6, X longitude >-1.9, X longitude<-1.8, X feature_type F, F name "Desserte Voyageur"
Will limit the previous results set to train stations that are used for passenger service:
- Example 5: http:/domainname:8080/?rql=Any X WHERE X feature_type F, F name "PN public pour voitures sans barrières sans SAL"&vid=mapstraction.map
Finally, one can map all the level crossings for vehicules without barriers (there are 3704):


As you could see in the last URL, the map view was chosen directly with the parameter vid, meaning that the URL is shareable and can be easily included in a blog with a iframe for example.
Data sharing
The result of a query can also be "displayed" in RDF, thus allowing users to download a semantic version of the information, without having to do the preprocessing themselves:
<rdf:Description rdf:about="cwuri24684b3a955d4bb8830b50b4e7521450">
  <rdf:type rdf:resource="http://ns.cubicweb.org/cubicweb/0.0/Location"/>
  <cw:cw_source rdf:resource="http://some.url.demo/"/>
  <cw:longitude rdf:datatype="http://www.w3.org/2001/XMLSchema#float">-1.89599</cw:longitude>
  <cw:latitude rdf:datatype="http://www.w3.org/2001/XMLSchema#float">47.67778</cw:latitude>
  <cw:feature_type rdf:resource="http://some.url.demo/7222"/>
  <cw:data_source rdf:resource="http://some.url.demo/7206"/>
</rdf:Description>
Conclusion
For someone who knows the CubicWeb framework, a couple hours are enough to create a CubicWeb application that stores, displays, queries and shares data downloaded from http://www.data.gouv.fr/
The full source code for the above will be released before the end of the week.
If you want to see more of CubicWeb in action, browse http://data.bnf.fr or learn how to develop your own application at http://docs.cubicweb.org/
